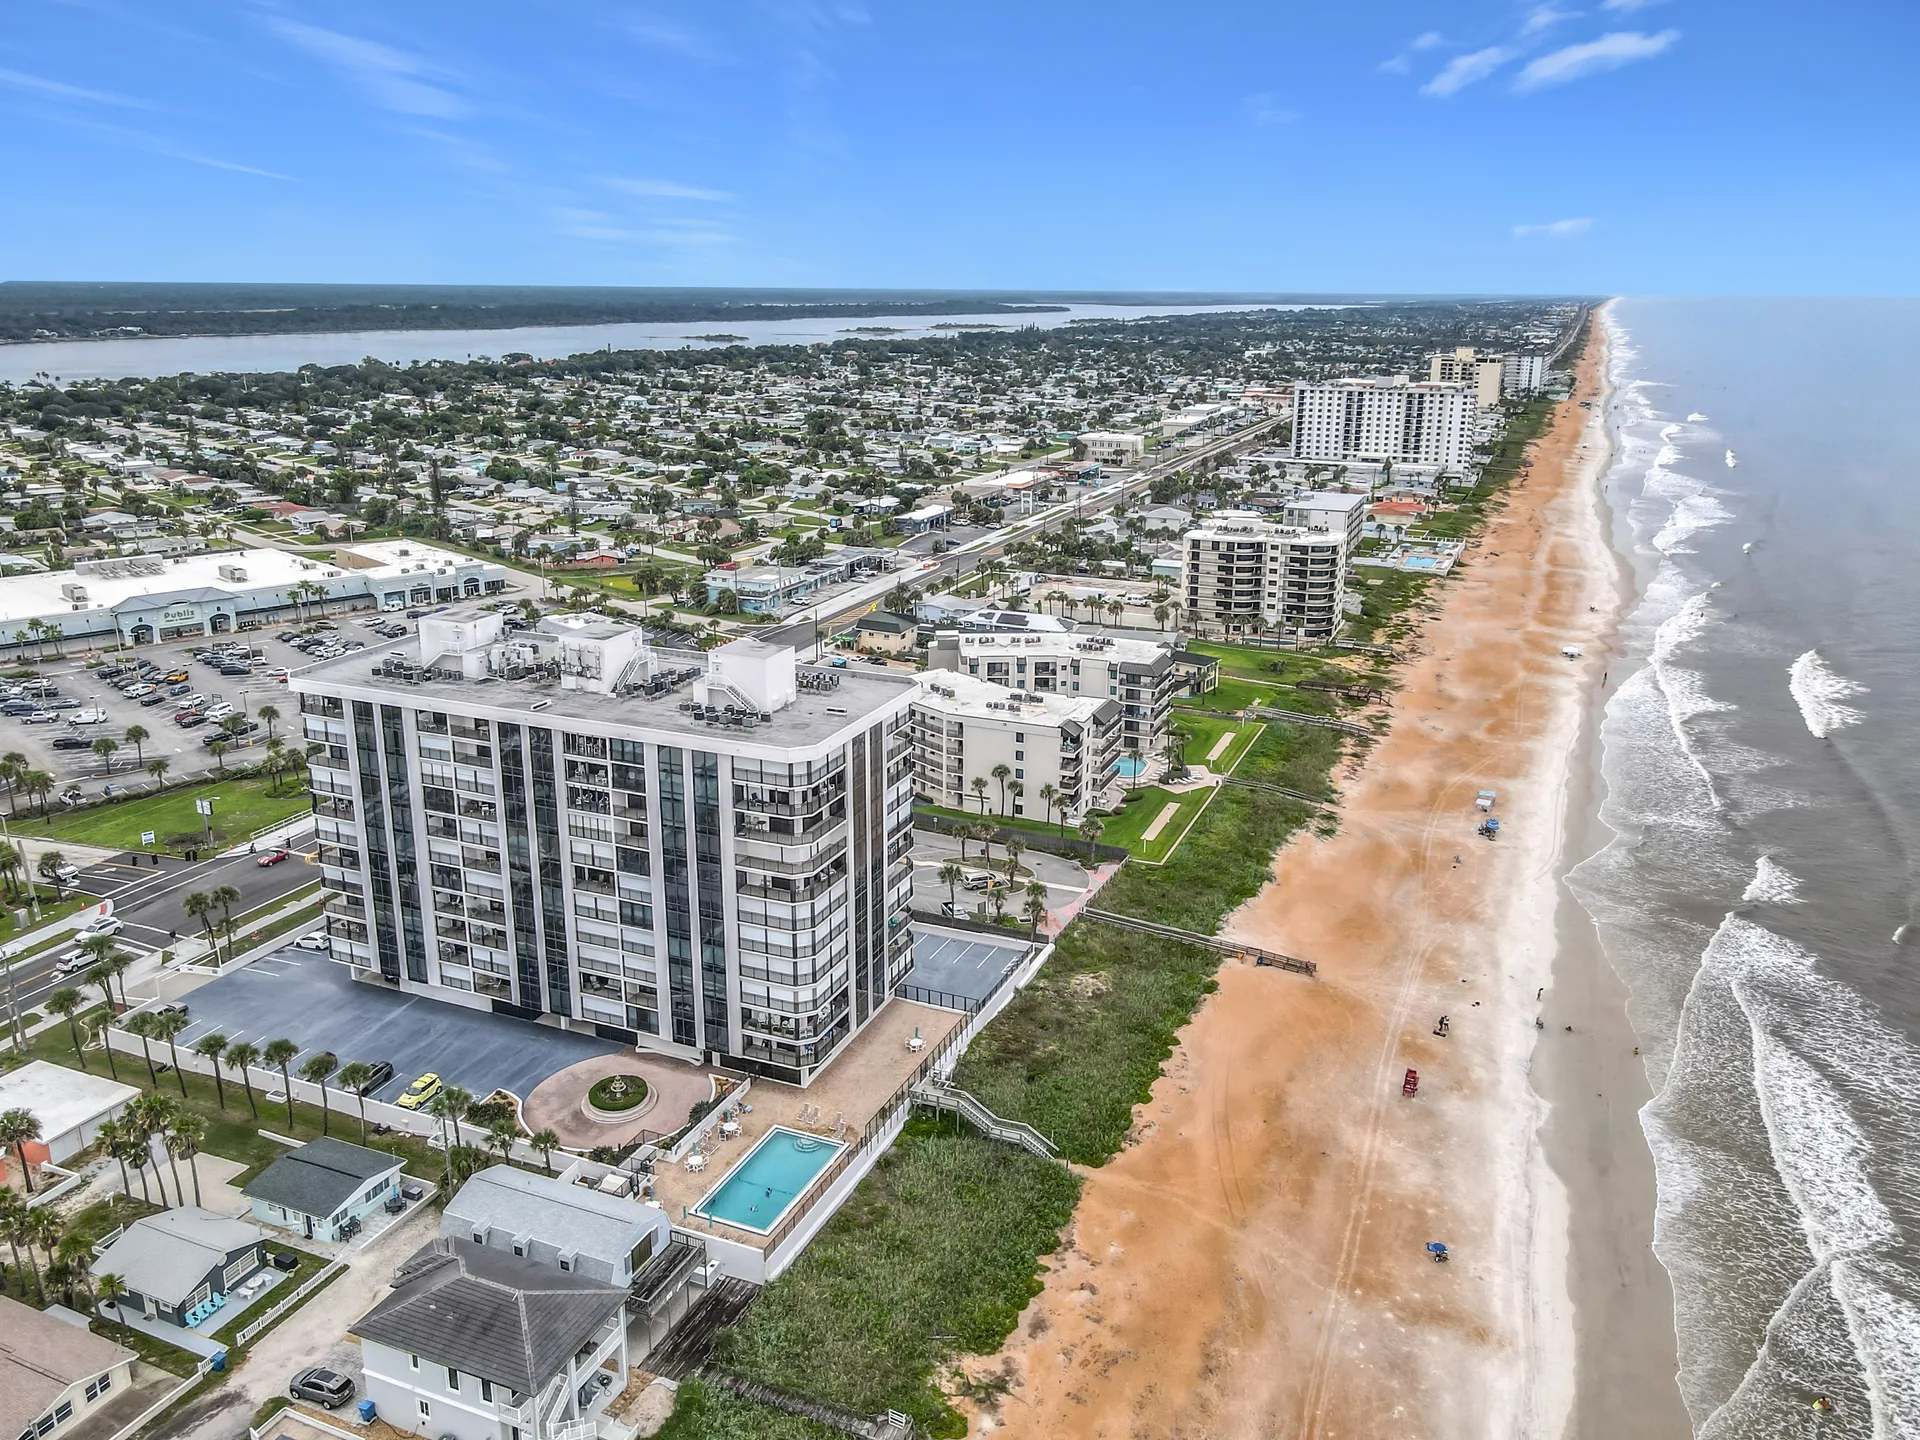
The most current published figures describe a balanced Ormond Beach market: median sale prices near $400,000, homes selling in roughly two to three months, and inventory hovering around 4.7 months. This snapshot pulls the latest sourced numbers so you can see where the market actually stands before you make an offer or decide on a price.
What the Latest Published Figures Show
The freshest number is a ZIP-level report for 32174 (Ormond Beach) from Move with Momentum, updated October 5 from live MLS data across 25 communities: a median sale price of $410,350, down 3.7% year over year, homes going under contract in about 88 days, and 105 active listings. Figures vary by source and reporting window, which is normal; ZIP-level reports track a different universe than citywide medians.
Recent citywide snapshots for Ormond Beach cluster in the $400,000 range. Stellar MLS data compiled by MaxLife Realty for Q3 2026 puts the 12-month median sold price near $402,000, with 59 median days on market and a 96.4% sold-to-list ratio. Broker One's July 2026 report shows a $400,000 median with 93 days on market, while Redfin reported $386,000 for its three months ending April 2026, up 5.7% year over year.
Numbers vary by source and reporting window, which is normal. Instead of chasing a single headline, watch the direction: homes are selling more slowly than a year ago, and inventory is building.
Inventory Is the Balanced-Market Signal
Ormond Beach holds roughly 4.7 months of inventory per the Stellar MLS Q3 2026 report. Real estate economists generally treat four to six months of supply as a balanced market: enough choices for buyers, enough demand for sellers. The area is no longer the instant-offer environment of 2021 and 2022.
Volusia County tells the same story. Coastal Volusia Homes reports 4.2 months of inventory and a county median sale price near $337,000, down 3.9% year over year. Redfin lists the county median at $343,000, down 1.4%, and the St. Louis Fed's median listing price series shows roughly $365,000 for August 2026, with county-wide days on market in the mid-70s.
Where Condos Fit In
There is no current, city-level published median price for Ormond Beach condos specifically, so treat any single condo figure with healthy skepticism. Published medians blend single-family homes and condos, and on the oceanfront the spread is wide: a unit's value comes down to exposure, condition, and the building itself.
For a unit like 7F6 at 1239 Ocean Shore Blvd, the position-setting features are direct ocean frontage on a no-drive beach, impact-rated sliding glass doors and windows, power hurricane shutters on both balconies, dual north and south balconies, underground parking with storage, and resort-style amenities. Those are the items buyers actually tour for, and they are the items a comparable market analysis weighs most heavily.
What to Do With These Numbers
- Buyers. Balanced inventory means time to tour, compare, and negotiate. Before offering on any oceanfront condo, verify the monthly maintenance fee, insurance picture, and building financials with real documents, not listing descriptions.
- Sellers. With days on market stretched, pricing to the comparable evidence matters more than ever. Storm readiness, impact glass, shutters, and direct ocean exposure are what justify a premium in this market.
- Both sides. Published medians trail the present moment. A current, local comparable market analysis beats any headline when you are pricing a specific oceanfront unit.
Market figures above are drawn from the linked public sources and vary by reporting period and methodology. They are a snapshot of the city and county market, not a valuation of any specific property.
Want these numbers applied to your situation? Contact Debbie Weller for a current comparable market analysis of oceanfront condos in Ormond Beach, whether you are buying or selling.